Working with HexMaps Output
The Output File
Running HexMaps produces an Astropy Enhanced CSV (.ecsv) file in the
output/ directory. The filename follows the pattern:
<source>_hexmaps_<res_suffix>_<date>.ecsv
For example: ngc5194_hexmaps_27p0as_2025_01_01.ecsv
The .ecsv format is human-readable plain text. Open it with:
from astropy.table import Table
table = Table.read("output/ngc5194_hexmaps_27p0as_2025_01_01.ecsv")
print(table.colnames)
Or using the HexMaps convenience loader:
from hexmaps.utils_table import load_hexmaps
table = load_hexmaps("output/ngc5194_hexmaps_27p0as_2025_01_01.ecsv")
Column Naming Conventions
Column pattern |
Content |
|---|---|
|
Sightline sky coordinates (or |
|
Deprojected galactocentric radius (galaxy targets) |
|
Full spectrum per sightline |
|
Integrated intensity (moment 0) |
|
Intensity-weighted mean velocity (moment 1) |
|
Intensity-weighted line width (moment 2) |
|
Per-sightline RMS noise |
|
Peak brightness temperature |
|
Equivalent width |
|
2D band map values |
The HexMapsAnalysis Class
import sys
sys.path.append("analysis/")
from hexmaps_analysis import HexMapsAnalysis

db = HexMapsAnalysis("output/ngc5194_hexmaps_27p0as_2025_01_01.ecsv")
print(db)
# HexMapsAnalysis(source='ngc5194', n_pts=939, lines=['12CO21', '12CO10'])
Quick Examples
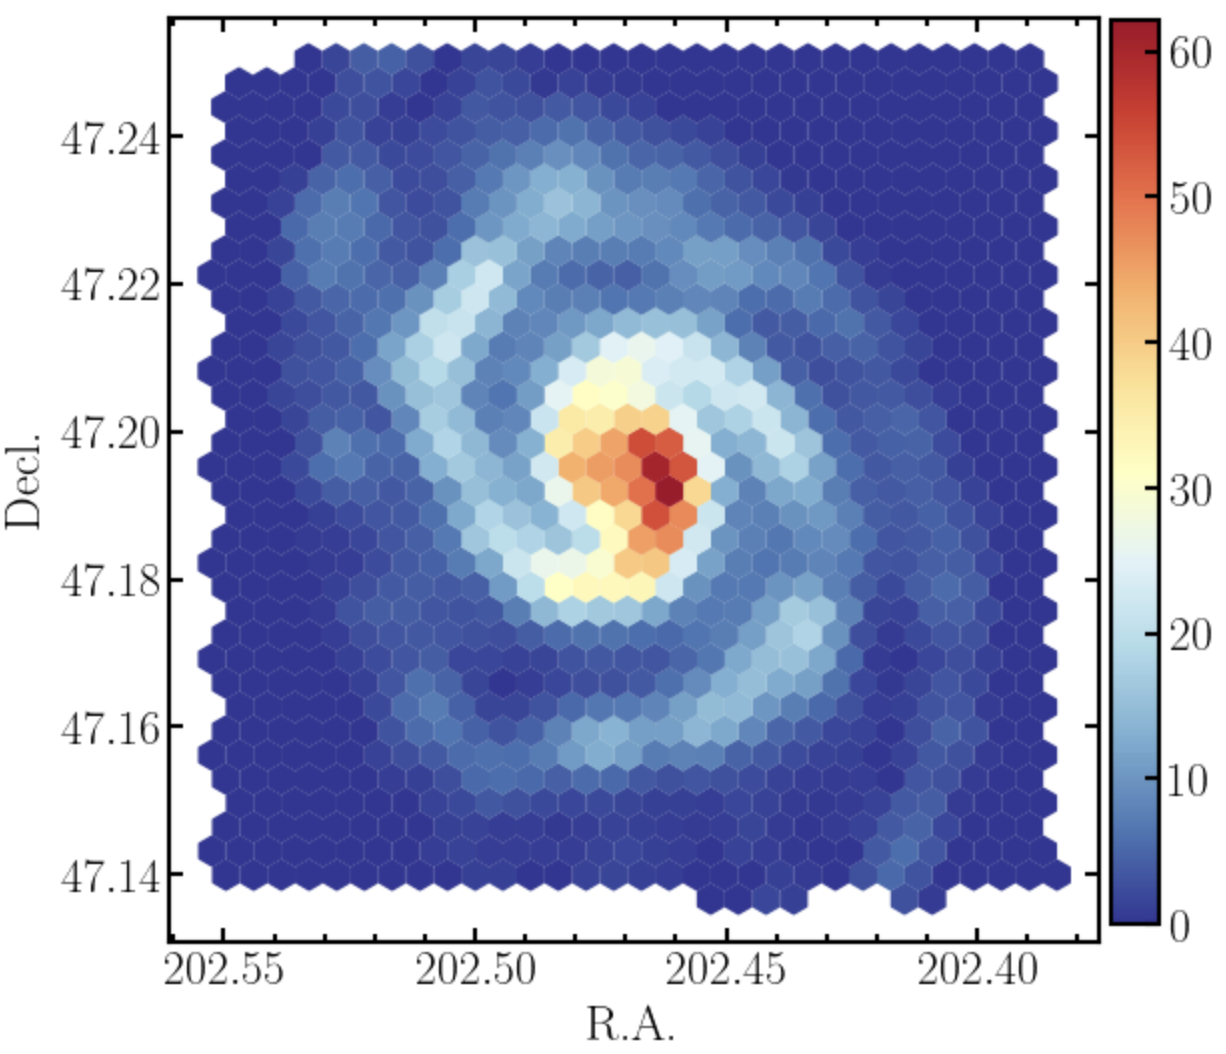
Plot a 2D moment map:
db.quickplot_map("12CO21")
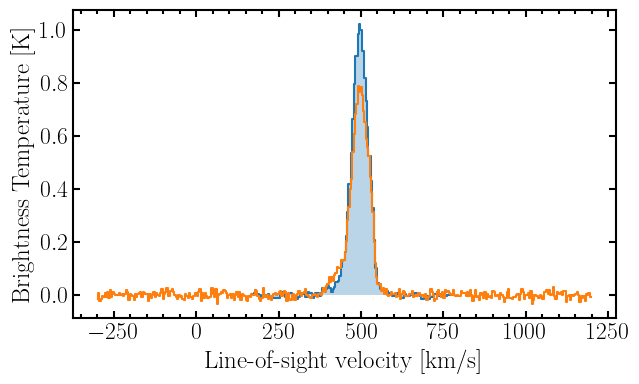
Plot a spectrum at the brightest sightline:
db.quickplot_spectrum("12CO21")
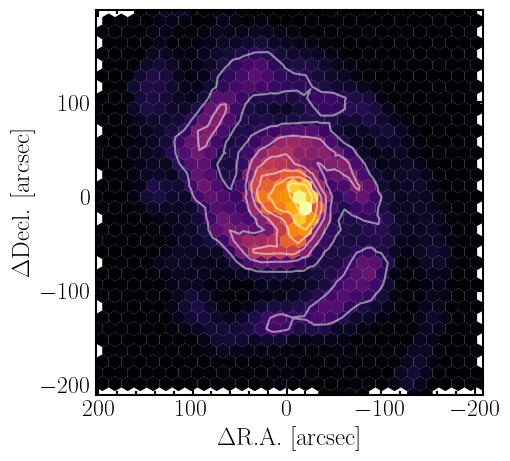
Custom 2D scatter map:
import matplotlib.pyplot as plt

ra, dec = db.get_coordinates("13:29:52.7 47:11:43")
mom0    = db.struct["MOM0_12CO21"]

fig, ax = plt.subplots(figsize=(5, 5))
sc = ax.scatter(ra, dec, c=mom0, s=90, marker="h", cmap="inferno")
ax.invert_xaxis()
ax.set_xlabel(r"$\Delta$R.A. [arcsec]")
ax.set_ylabel(r"$\Delta$Decl. [arcsec]")
plt.colorbar(sc, label="MOM0 [K km/s]")
plt.show()
Compute a line ratio:
ratio = db.get_ratio("12CO21", "12CO10", sn=5.0)
print(ratio["ratio"])   # CO(2-1)/CO(1-0) ratio array
Radial profile:
db.quickplot_radial_profile("12CO21")
Provenance Recovery
Every .ecsv file embeds the full provenance of the run that produced it:
# Recover config.txt used for this run
print(db.get_config())
db.get_config(save_to="recovered_config.txt")

# Recover the full pipeline log (Loading + Regrid + Products)
print(db.get_log())
db.get_log(save_to="run.log")

# List all embedded raw FITS headers
print(db.list_input_headers())
# ['12CO10', '12CO21', 'OVERLAY', 'SPIRE250']

# Recover a specific header
hdr = db.get_input_header("12CO21")
print(f"Native beam: {hdr['BMAJ'] * 3600:.1f} arcsec")
Accessing the Raw Table
# All column names
print(db.struct.colnames)

# Galactocentric radii in kpc (galaxy targets only)
print(db.struct["rgal_kpc"])

# Spectrum of the brightest CO(2-1) sightline
import numpy as np
idx  = np.argmax(db.struct["MOM0_12CO21"])
spec = db.struct["SPEC_12CO21"][idx]
vax  = db.struct["SPEC_VAXIS"][idx]