Working with PyStructures
How to open the file
When you run the create_database.py script (see Running the Example), it creates a
.npy file, which simply contains a dictionary. To open this dicionary (for example in another Python scripts
or in Jupyter Notebook), you can simply run:
import numpy as np
database = np.load("<path to npy file>", allow_pickle = True).item()
The instance database is now a Python dictionary, and the relevant, processed data can be extracted using this infrastructure.
For example database['rgal_kpc'] returns an array containing the galacocentric distances of each point (in kpc).
The PyStructure class
The download comes with a script that lets you handle the PyStructure output as a Python class.
This makes it easier to work and use with the databases.
To read in a database, you can use the following synthax: .. code-block:
import sys
sys.path.append("<path to PyStructure/scritps folder")
import PyStructure as ps

database = ps.PyStructure("path_to_file.npy")
This way you have extracted the databse as a dictionary, and can access it (for example the galactocentric radii) using database.struct['rgal_kpc'].
Quick Examples
Using the PyStructure class environment, some useful commands are:
List of lines (3D cubes) included in PyStructure
print(database.lines)
>>> ['12CO21', '12CO10']
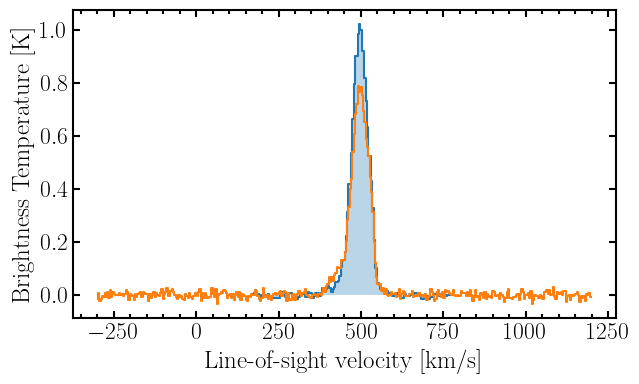
Extract and plot spectrum (e.g. of brightest sightline)
import matplotlib.pyplot as plt

vaxis = database.get_vaxis()

#extract the CO(1-0) integrated intensities
ii_co10=database.struct['INT_VAL_12CO10']

#find index of largest intensity (i.e. the brightest sightline)
idx_brightes = np.argmax(ii_co10)

spec_co10 = database.struct['SPEC_VAL_12CO10'][idx_brightes,:]

#plot spectrum
plt.figure()
plt.step(vaxis, spec_co10)
plt.show()
Make 2D map of integrated intensities (quicklook)
database.quickplot_2Dmap('12CO10')
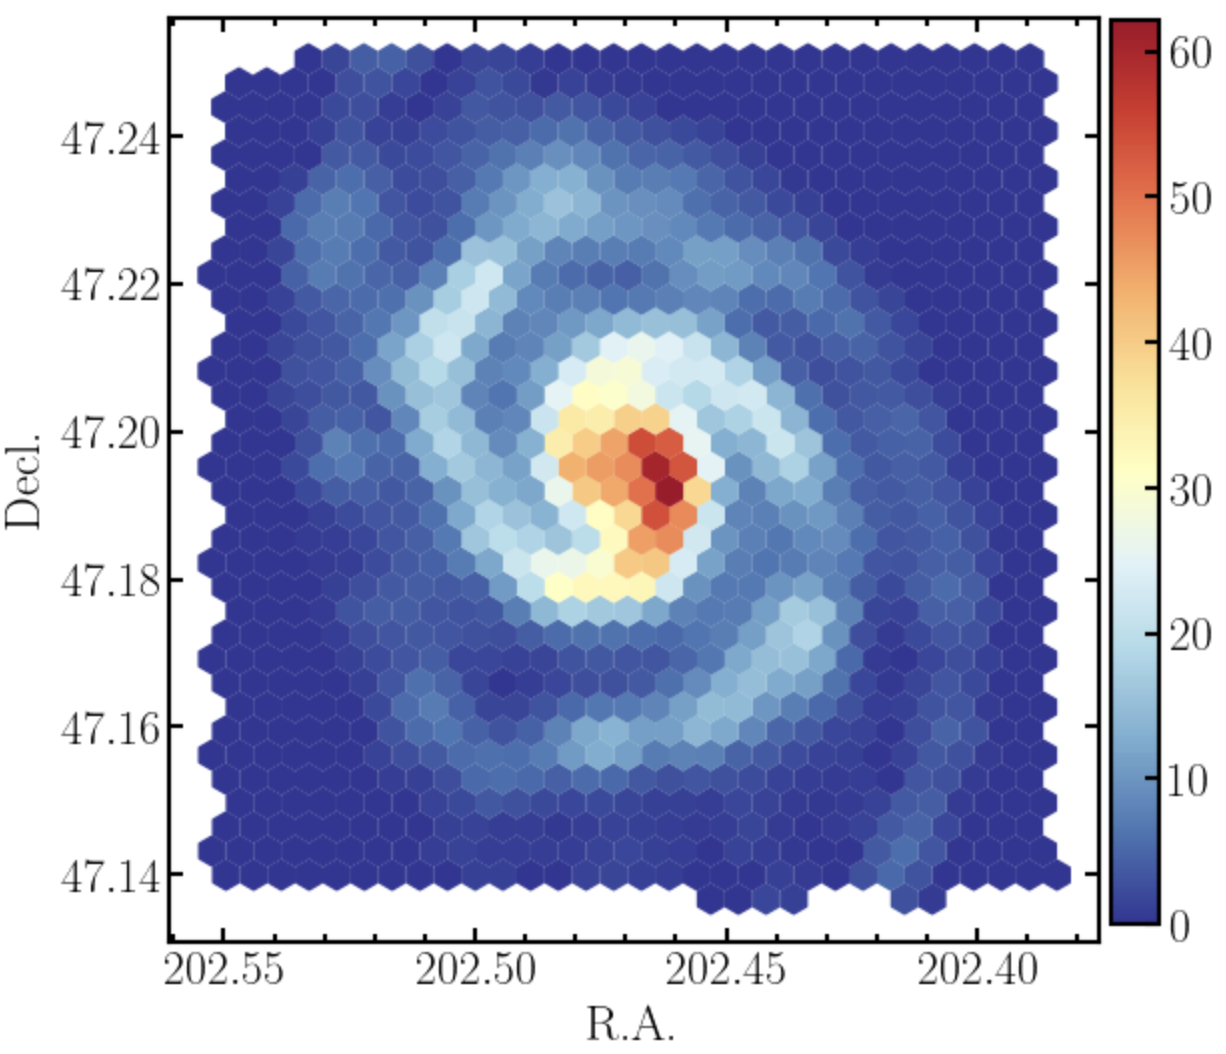
This function makes it possible to have a quick look at the integrated intensity one of the cubes that are loaded in the PyStructure.
Make 2D map of integrated intensities (more extended)
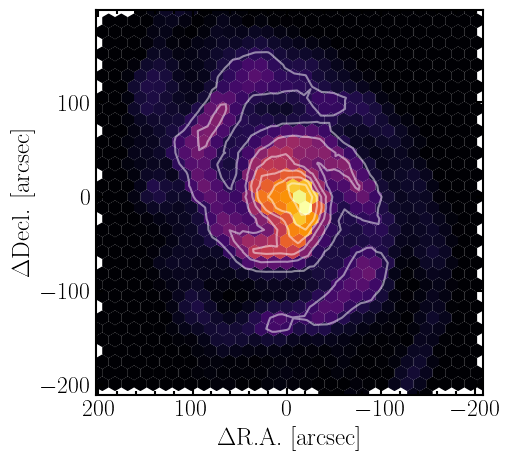
We can also produce the maps ourselves, such that we have some more advanced options .. code-block:
# Extract coordinates. We do not have to provide the center coordinate, this just
# returns the coordinates relative to the reference coordinate.
ra, dec = database.get_coordinates("13:29:52.7 47:11:43")

ii_co10=database.struct['INT_VAL_12CO10']
ii_co21=database.struct['INT_VAL_12CO21']

plt.figure(figsize=(5,5))
ax=plt.subplot(1,1,1)
plt.scatter(ra, dec,c=ii_co10, s=90, marker='h', cmap='inferno')
plt.tricontour(ra, dec,ii_co21, colors='w', alpha=.5)
ax.invert_xaxis()
ax.set_xlabel(r'$\Delta$R.A. [arcsec]')
ax.set_ylabel(r'$\Delta$Decl. [arcsec]')
plt.show()